Drafting Rookie Running Backs: A Primer
Building a Dynasty · Part 10 of 12
Drafting Rookie Running Backs: A Primer
Drafting rookie running backs is an emotional endeavor. It's extremely hard to get quality, productive RBs in rookie drafts if you're not in the top half of the first round, as the obvious (or seemingly obvious) choices are off the board in the first four or five picks. Annually, we reach for RBs that seem to be in prime situations even though their metrics don't indicate a level of athleticism or college production that would translate to NFL success. This is where Dynasty MatriX can help. Let's start with what the model actually knows about the position, then apply it to the class on the board right now.
Here is the RB hit rate by decile. A hit means the player reached a career tier of Starter or Star, across every RB prospect in the 2001 through 2020 draft classes.
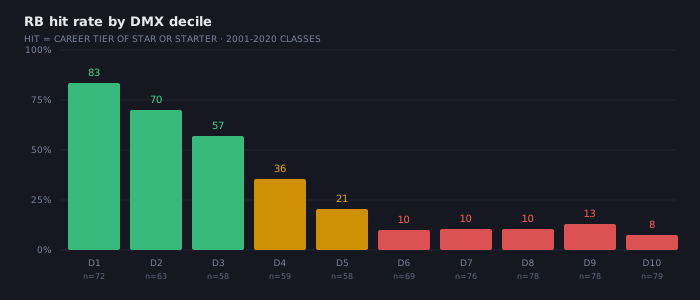
Running back is the position where the model separates most cleanly. Decile 1 hits at 83%, decile 2 at 70%, decile 3 at 57%, decile 4 at 36%. Below that it flatlines between 8% and 13% and stays there all the way down. Combine the top two deciles and you get 77% out of 135 prospects. Deciles 3 through 10 together are 19% out of 555. The top of the board is not marginally better at running back, it is four times better.
The raw score tells the same story with more resolution:
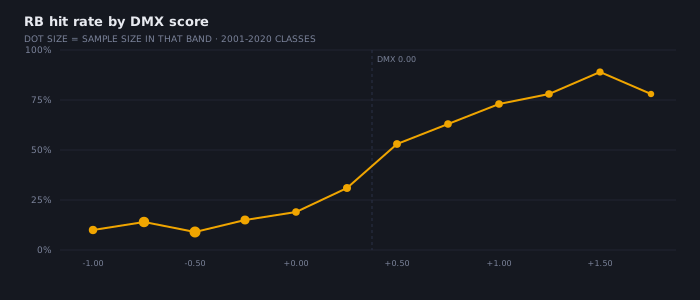
Sliced by score rather than decile, the picture is this. Negative DMX backs hit 11% of the time out of 395 prospects, and only 6% became Stars. From 0.00 to 0.69 the hit rate is 34%. From 0.70 to 1.19 it is 64%. Above 1.20 it is 83%, with 47% reaching Star. Every quarter point of DMX you give up in a rookie draft costs you real probability, and the cost is steepest between 0.50 and 1.20, which is exactly the range where most of the argument in your rookie draft happens.
The speed score question
Speed score is the component I get asked about most, because it is the one that most often disagrees with the tape and the depth chart. Here is what it is worth on its own:
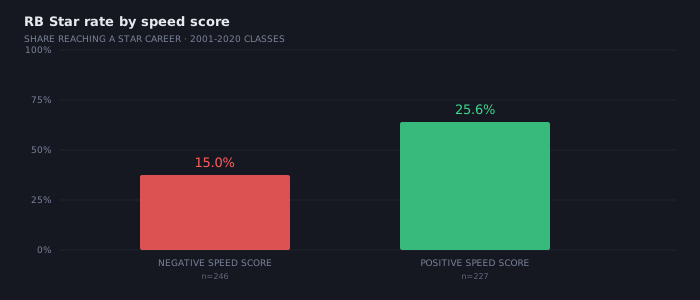
Backs with a below-average speed score reach a Star career 15% of the time out of 246 prospects. Backs with an above-average speed score do it 25.6% of the time out of 227. Widen it to any hit and it's 32% against 50%.
I want to be careful here, because when I first wrote about this years ago I leaned on a much narrower definition of success and came away with a number close to 1%, which made it sound like a slow back was a dead pick. That was too strong. Against the career-tier definition we use now, and with two more decades of prospects in the set, a slow back is roughly two-thirds as likely to become a Star as a fast one. That is a real and useful edge. It is not a disqualifier.
So the way I use it is as a tiebreaker rather than a veto. If two backs are close on DMX and one of them has the speed score, take the one with the speed score. If a back has a strong DMX and a poor speed score, the DMX is still doing the heavy lifting and I'm not walking away. Cam Skattebo came out of the 2025 class with a decile 2 DMX and a speed score of -0.87 and I would not have passed on him for it.
The current class
Here is the 2026 rookie RB class sorted by DMX, with speed score where we have a verified measurement:
| Player | Team | DMX | Decile | Speed |
|---|---|---|---|---|
| Jeremiyah Love | ARI | 1.89 | 1 | 1.62 |
| Jadarian Price | SEA | 1.07 | 2 | -0.16 |
| Mike Washington Jr. | LV | 0.86 | 3 | 2.59 |
| Emmett Johnson | KC | 0.59 | 3 | -0.82 |
| Jonah Coleman | DEN | 0.50 | 4 | — |
| Adam Randall | BAL | 0.34 | 4 | 1.19 |
| Kaelon Black | SF | 0.30 | 4 | — |
| Nick Singleton | TEN | 0.19 | 5 | — |
| Kaytron Allen | WAS | 0.14 | 5 | — |
| Demond Claiborne | MIN | 0.09 | 5 | 0.17 |
| Eli Heidenreich | PIT | -0.19 | 6 | 0.05 |
| Kejon Owens | MIN | -0.29 | 6 | — |
| Kentrel Bullock | CIN | -0.34 | 7 | — |
| Dean Connors | LA | -0.36 | 7 | — |
| Seth McGowan | IND | -0.37 | 7 | 0.84 |
| Jaydn Ott | KC | -0.39 | 7 | — |
| Chip Trayanum | NYJ | -0.39 | 7 | — |
| Robert Henry | WAS | -0.41 | 7 | -0.77 |
| Jam Miller | NE | -0.47 | 8 | — |
2026 rookie RB class by DMX score. Full board, including the rest of the class, on the Draft Board.
This is a top-heavy class and the chart above tells you what to do with it. Jeremiyah Love is the only back in the class clear of 1.20, which is the band that hits 83%. He is worth a top pick and he has the speed score to go with it. Jadarian Price and Mike Washington Jr. are the other two in the 0.70 to 1.19 range, the band that hits 64%. Price's soft speed score is not enough for me to move off him given where the rest of the class sits. Washington is the one I'd go out of my way for. A 2.59 speed score is the best in this class by a distance, he ran a 4.33 at 223 pounds, and he backed it up with a 1,068-yard final season at Arkansas after transferring twice. A fourth-round landing spot in Las Vegas is the kind of price that makes the profile worth owning.
After those three you are in the 0.00 to 0.69 band, which historically hits 34% of the time. Emmett Johnson, Jonah Coleman, Adam Randall and Kaelon Black are all real prospects at the right price, which is the back half of round two and later. Randall is the interesting one, because a 1.19 speed score attached to a decile 4 DMX is the profile that occasionally breaks out when the depth chart opens up.
Everyone from Eli Heidenreich down carries a negative DMX. That group has hit 11% of the time in twenty-five years of data and produced a Star 6% of the time. I don't draft them. If one of them wins a job in camp, the waiver wire will still be there.
Conclusion
The mistake I see every year is the same one. A back gets hyped because of where he landed, the ADP climbs past better prospects, and somebody spends a first on a profile the data says is a 34% shot. The fix isn't complicated. Take the elite scores early, take the middle band at middle-band prices, and let somebody else have the negative-DMX backs with the great situations. You will miss on a few. You will miss on far fewer than the guy drafting off the depth chart.